FFCollusion
Footballguy
I often try to monitor other ideas or theories myself, to see if they have merit, not only in hindsight, but foresight. This year and last year, someone presented me with THIS and THIS. In short known as the Juggernaut RunningBack.
I'm going to summarize the parameters set by the article and layout a path for measuring success that makes sense to me. Caveat being I only read through it once, I don't have all access to the stats they might, and everything is subject to my interpretation.
First, let's establish to everyone what we're chasing. In full PPR scoring, we are trying to identify the indicators that best predict a fantasy season that is equivalent to 372 total points, or 21.9 points per game.
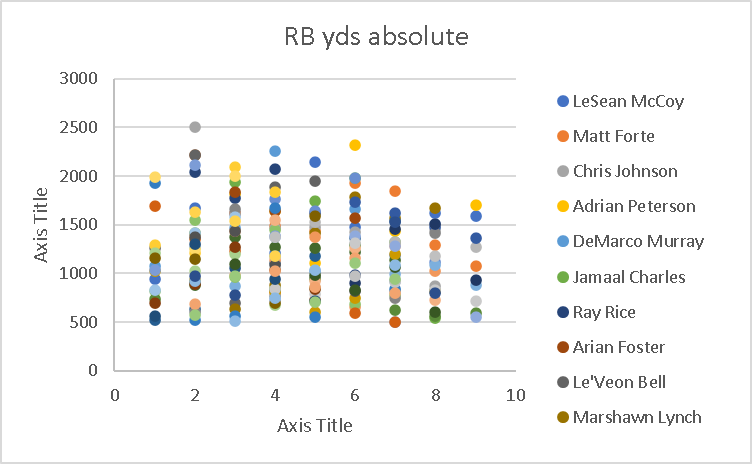
Just for reference, since I already did the work, here is every RB1 of the past decade:
In 2022 Ekeler scored 378
In 2021 JT scored 377
In 2020 Kamara scored 377
In 2019 CMC scored 469
In 2018 Barkley scored 389
In 2017 Gurley scored 383
In 2016 D.Johnson scored 411
In 2015 Freeman scored 320
In 2014 Bell scored 370
In 2013 Jamaal scored 382
That's a pretty interesting trend for 7 of the last 10 years, it seems like 370-380 is the sweet spot, other than a few outliers
So the summary of the article is that there are 6 indicators of future success.
1: Age - <26 as of Dec 31st current season/year
2: ADP - Tier 1 = <19 Tier 2 <28
3: NFL ADP - Tier 1 = <74, Tier 2 <106
4: Speed Score - Tier 1 = 1 67+. Tier 2 = 53+
5: Target Share - Tier 1 = 11.5+, Tier 2 = 6.5+
6: Team Wins - Tier 1 = 7.5+, Tier 2 = 4+
 postimg.cc
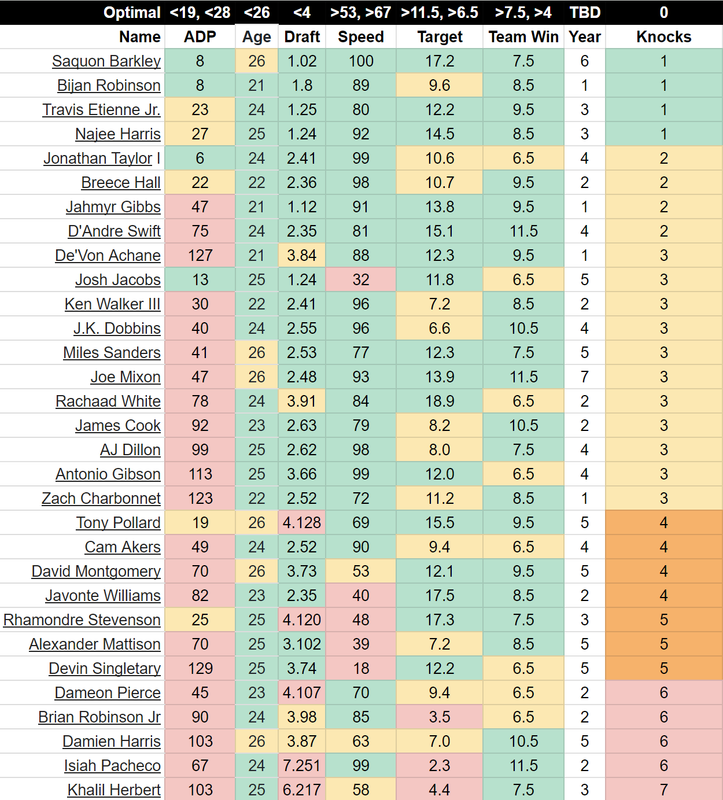
Here is every RB of relevance 26 or younger. Relevance is up to my discretion, so take that with a grain of salt.
Obviously it's July 15th, ADPs will drastically change. I used Yahoo ADPs. I also converted win percentage to total games so they correlate to Vegas over/unders.
I've sorted the RBs by 'knocks' from least to most, as 0 'knocks' would be the optimal outcome.
Green = 0 knocks, yellow = 1 knock, and red = 2 knocks, all of which correlate to the tiers defined above.
Example of tiers: ADP, Tier 0 is ADP less than 19, Tier 1 is 19-27, and Tier 2 is an ADP 28 or higher.
Tier 0 = green = 0 knock. Tier 1 = yellow = 1 knock, Tier 2 = red = 2 knocks.
Interestingly enough, there isn't a single RB with 0 knocks.
I added a 'year' column, because I'm hoping BaoBou will help me identify the peak of a RBs career, either in NFL years, Starter years, or whatever. It is listed as what THIS year will be for them. Ergo, the 2023 season will be Barkley's 6th NFL year. (next Post)
I'm too lazy to check ages as of Dec31st, I just used current age.
NFL Draft is written as round.pick. Saquon 1.02, he was drafted in the 1st round, the 2nd pick overall. Pacheco was drafted in the 7th round, 251st pick overall.
Perhaps I'll update this as we get closer to real draft season, for the ADP column. Personally I would put less emphasis on the ADP column today, or even in general, because I have zero faith in the general population of fantasy players. Meaning, the only 'knocks' that Gibbs and Swift have, is that the community is drafting them low. It's up to you, or me, or us, to decide if the community is accurately drafting them. (aka whether Yahoo is accurately ranking them)
I'm going to summarize the parameters set by the article and layout a path for measuring success that makes sense to me. Caveat being I only read through it once, I don't have all access to the stats they might, and everything is subject to my interpretation.
First, let's establish to everyone what we're chasing. In full PPR scoring, we are trying to identify the indicators that best predict a fantasy season that is equivalent to 372 total points, or 21.9 points per game.
Just for reference, since I already did the work, here is every RB1 of the past decade:
In 2022 Ekeler scored 378
In 2021 JT scored 377
In 2020 Kamara scored 377
In 2019 CMC scored 469
In 2018 Barkley scored 389
In 2017 Gurley scored 383
In 2016 D.Johnson scored 411
In 2015 Freeman scored 320
In 2014 Bell scored 370
In 2013 Jamaal scored 382
That's a pretty interesting trend for 7 of the last 10 years, it seems like 370-380 is the sweet spot, other than a few outliers
So the summary of the article is that there are 6 indicators of future success.
1: Age - <26 as of Dec 31st current season/year
2: ADP - Tier 1 = <19 Tier 2 <28
3: NFL ADP - Tier 1 = <74, Tier 2 <106
4: Speed Score - Tier 1 = 1 67+. Tier 2 = 53+
5: Target Share - Tier 1 = 11.5+, Tier 2 = 6.5+
6: Team Wins - Tier 1 = 7.5+, Tier 2 = 4+
Untitled — Postimages
Here is every RB of relevance 26 or younger. Relevance is up to my discretion, so take that with a grain of salt.
Obviously it's July 15th, ADPs will drastically change. I used Yahoo ADPs. I also converted win percentage to total games so they correlate to Vegas over/unders.
I've sorted the RBs by 'knocks' from least to most, as 0 'knocks' would be the optimal outcome.
Green = 0 knocks, yellow = 1 knock, and red = 2 knocks, all of which correlate to the tiers defined above.
Example of tiers: ADP, Tier 0 is ADP less than 19, Tier 1 is 19-27, and Tier 2 is an ADP 28 or higher.
Tier 0 = green = 0 knock. Tier 1 = yellow = 1 knock, Tier 2 = red = 2 knocks.
Interestingly enough, there isn't a single RB with 0 knocks.
I added a 'year' column, because I'm hoping BaoBou will help me identify the peak of a RBs career, either in NFL years, Starter years, or whatever. It is listed as what THIS year will be for them. Ergo, the 2023 season will be Barkley's 6th NFL year. (next Post)
I'm too lazy to check ages as of Dec31st, I just used current age.
NFL Draft is written as round.pick. Saquon 1.02, he was drafted in the 1st round, the 2nd pick overall. Pacheco was drafted in the 7th round, 251st pick overall.
Perhaps I'll update this as we get closer to real draft season, for the ADP column. Personally I would put less emphasis on the ADP column today, or even in general, because I have zero faith in the general population of fantasy players. Meaning, the only 'knocks' that Gibbs and Swift have, is that the community is drafting them low. It's up to you, or me, or us, to decide if the community is accurately drafting them. (aka whether Yahoo is accurately ranking them)